With the advancement of laser technology, the industry’s requirements for the reliability of solid-state lasers have become increasingly stringent. The optical structure is the foundation for stable operation, and the electro-control sensing system is equally critical. As the core of the electrical control system, the temperature and humidity data and cooling water flow rate collected by sensors are prerequisites for the safe operation of the laser; their reliability directly determines the system’s decision-making and operational safety.
The laser adopts a fully enclosed cavity, and its internal parameters rely entirely on sensor monitoring; however, complex environments, electromagnetic interference, and hardware fluctuations can easily lead to data distortion. This article will introduce the types and principles of mainstream laser sensor, and from five dimensions, elaborate on the data reliability assurance schemes commonly used in engineering implementation.
The laser control system mainly consists of the main control module, execution devices (such as motors and constant current power supplies), operation status detection devices three parts. To monitor the laser’s operating status in real time and ensure its normal operation, the system integrates multiple functional sensors, which are introduced below:
Temperature sensors use NTC thermistor materials , whose resistance decreases as temperature increases; the system can then calculate the corresponding temperature by detecting the resistance value。This sensor features high sensitivity, rapid response, small size for easy integration, and simple wiring advantages, allowing it to fit closely with pump or frequency-doubling modules to quickly capture temperature changes within the device。When the pump temperature exceeds the limit, the control system can respond promptly and quickly adapt to changes in the frequency temperature, achieving precise temperature control.
The temperature and humidity sensor is integrated on a single circuit board with dual functions of temperature measurement and humidity measurement, where the temperature sensing element also adopts an NTC thermistor. Humidity detection relies on specialized hygroscopic elements operating as follows: the hygroscopic material interacts with water molecules in the air, converting humidity changes into resistance or capacitance signals, which are then processed by a circuit to measure humidity.
This system uses capacitive humidity and temperature sensors; when the hygroscopic material adsorbs water molecules, the dielectric constant changes, causing a change in capacitance; after circuit processing, this capacitance change is converted into a digital signal to output the humidity value. This sensor is small in size, fast in response, and low in power consumption, enabling real-time monitoring of humidity inside the laser cavity. Once the humidity exceeds the threshold, the system will promptly issue an alert, prompting staff to initiate dehumidification operations to prevent condensation on optical components and provide comprehensive protection for the laser.
In the system, a turbine flowmeter is used to convert flow velocity into the rotational speed of the turbine, which is then converted into an electrical signal proportional to the flow rate. The turbine consists of lightly conductive blades, which produce a set of electrical pulses whenever the blades pass through the magnetic induction unit.When the fluid passes through, the flow meter outputs a continuous series of pulse signals; by measuring the frequency of these pulses, the flow rate can be calculated.
The turbine flowmeter is compatible with multiple media, features high measurement accuracy, strong anti-interference capability, and low maintenance costs in the long term. The laser relies on fluid circulation for heat dissipation and to maintain stable operating temperatures; when the flow is detected to fall below the safe threshold, the system will trigger an emergency stop or an acoustic-optical alarm to alert staff to investigate the fault.
A fixed value upper and lower limit is pre-set, and when the sensor collects data that exceeds the threshold range, it is determined to be invalid data, and the system reserves the valid data until the compliance data is re-collected before completing the data update. The threshold can be set in combination with equipment operation logic and historical operating data, such as water cooling system flow, with a theoretical lower limit of 0 L / min, and a safety upper limit of 20 L / min combined with long-term operation data.
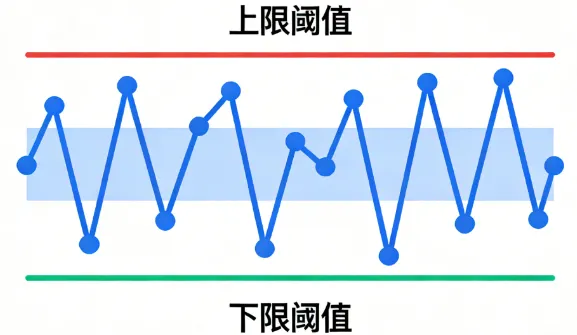
△ Static Threshold Method Diagram
The solution is suitable for static monitoring scenarios where the logic is simple, the amount of computation is small, and the changes of environmental parameters are smooth. The disadvantage is that there is insufficient flexibility to adapt to the dynamic changes in the working conditions and the environment.
For scenarios involving slow fluctuations in environmental parameters, the static threshold is enhanced with real-time threshold adjustment functionality. The system captures recent continuous data (such as the last 10 sets of sampled data), dynamically adjusts thresholds based on the overall characteristics of the data to determine whether the current data is valid, and repeatedly executes this logic.
△ Demonstration of Dynamic Threshold Method
The dynamic threshold method can adapt to the environment, but its computational logic is relatively complex; when faced with sudden abnormal conditions, there is a certain delay in response.
Relying on multiple sets of historical sampling data for mathematical analysis, single-point abnormal data are identified, mainly falling into two categories:
① Mean deviation detection
Calculate the average value of the data over a period of time. For each new data, compare the difference with the average. If the difference exceeds a certain value, the new data is considered invalid.
② Standard deviation analysis
Calculate the standard deviation of data in the most recent period (e.g. 10 times) prior to the new data, then calculate the standard deflection of data in 10 recent times, including the new data. Compare the differences between the two times, detect the degree of data discretion, and if the standard decrease is too large, the new data is abnormal.
When multiple sensors are deployed in the same location, when more than half of the sensors measure the same data, the new data is considered to be the value of most of the sensor. The hardware should select the same model of sensor with the same accuracy, and the installation position should be as close to each other to avoid interfering with each other; The data is collected synchronously on the software to ensure that the data of multiple sensors is collected at the same time.
This method increases cost and complexity, but can improve measurement accuracy and reliability for measurement of key parameters.
Sensor data is susceptible to distortion during transmission by electromagnetic interference, and transmission errors can be investigated through dedicated verification algorithms, which are two main methods:
① And Verification
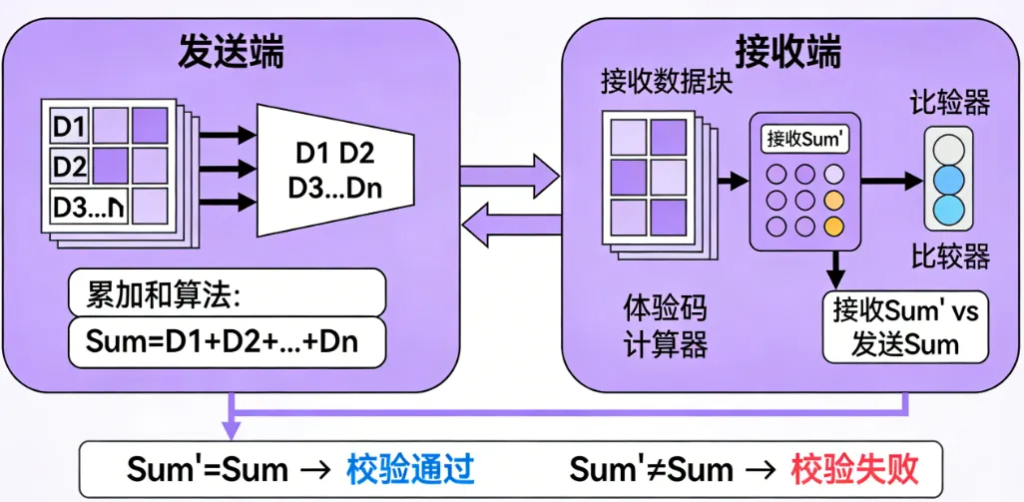
△ And Proofing Diagram
When data is transmitted, it can be seen as a series of data from sender to receiver, but if there is interference, some of the data in the data series may change during transmission, resulting in inconsistent data between the receiving and receiving parties, thereby transmitting the wrong data. Therefore, the individual data in the data string are added together, and the result is sent to the receiver together with the attached to the last part of the data string. After receiving the data, the recipient also adds the data once, comparing the result with that of the sender, and requesting retransmission or other measures if the validation does not match.
② CRC Validate
CRC verification uses cyclic redundancy check, detecting data transmission errors through polynomial division rather than addition-based checksums. The two parties compare their CRC values; if they do not match, a retransmission is requested or other measures are taken.
It should be noted that although the CRC error detection capability is significantly better than the sum check, the two methods still have detection blind spots for certain types of errors.
By comprehensively applying the above sensor data reliability detection measures, it can be ensured that the sensor data ultimately processed by the laser control system best aligns with actual conditions. When the laser operates normally, physical quantities such as temperature, flow rate, and humidity are slow-varying parameters; there is no phenomenon of instantaneous jumps followed by immediate recovery. Based on this characteristic, the aforementioned measures can accurately eliminate obvious abnormal data interference.
In addition to the above methods, there are many other data reliability assurance techniques. Different application scenarios have different requirements for data accuracy and real-time, and in actual engineering, a single method or combination of methods can be chosen according to the needs of the project.