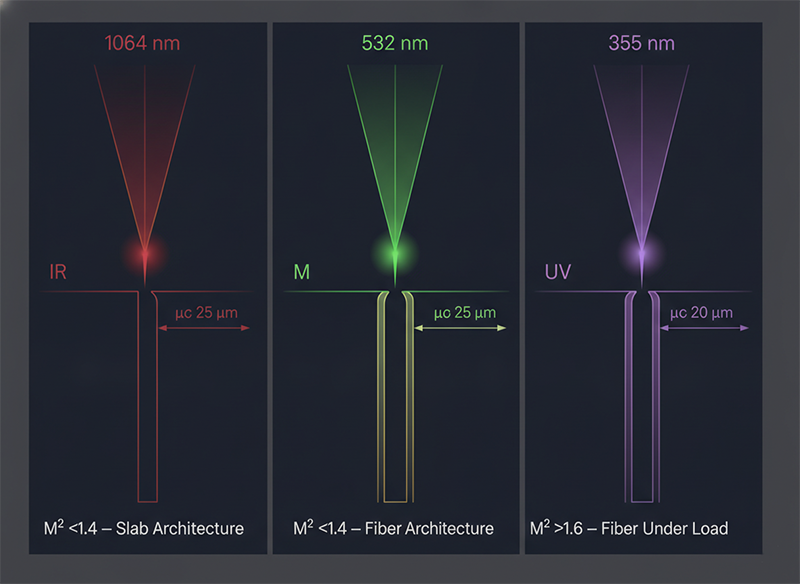
Every laser selection guide on the internet starts at the same place: wavelength. UV absorbs into polymers. IR heats metals. Green splits the difference. The framework is clean, teachable, and—for most industrial precision applications—incomplete in a way that costs production engineers real money.
The variable that wavelength comparisons omit is what happens to your beam after the wavelength is chosen. Specifically: does your amplifier architecture maintain beam quality under sustained thermal load, or does it drift?
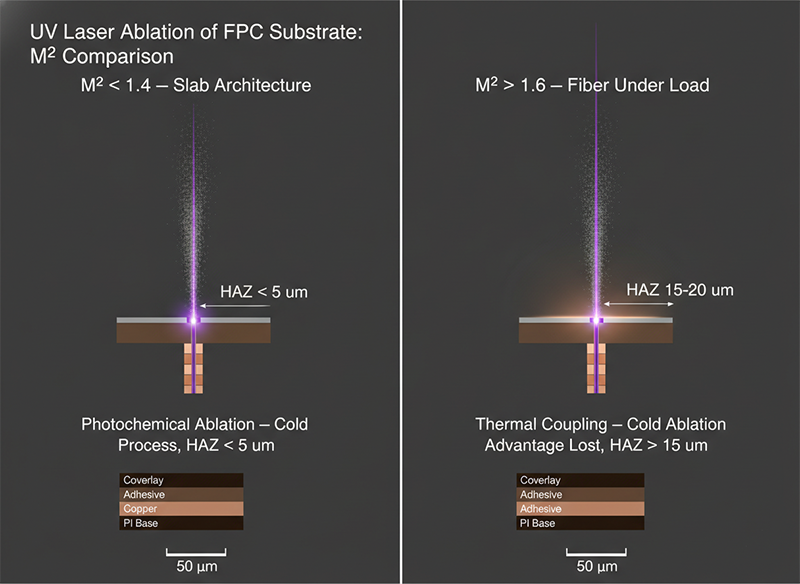
“The spec sheet said 355 nm UV. Both systems did. One was a fiber-amplified source running M² of 1.6 under sustained thermal load; the other used slab-integrated amplification holding M² below 1.4 across the full power range. At 15W average power, the fiber source’s focus spot grew to 28 µm — the ablation threshold dropped unevenly across the scan field, and edge deviation on a 50 µm FPC trace climbed to ±4 µm. The slab source held 18 µm spot and ±1.5 µm edge consistency through the same 8-hour run. Same wavelength. Different amplifier. A 2.6x precision gap that the wavelength column on the comparison matrix never captured.” — process engineer, UV picosecond laser qualification for FPC trace cutting
That gap—2.6x, on the same wavelength, in the same application—is the argument this article makes. Wavelength is a necessary input to laser selection. It is not a sufficient one.
Wavelength determines which materials absorb laser energy and through what mechanism—photochemical for UV, thermal for IR, with green operating between the two. But in high-precision industrial applications, the decision between UV, green, and IR lasers cannot stop at wavelength. M² (beam quality factor) determines actual focus spot size, which determines achievable precision and HAZ control. Amplifier architecture—slab versus fiber versus rod—determines whether M² stays stable as power increases. Two systems at identical wavelengths can produce precision outcomes separated by a factor of 2.6 or more.
Engineers search “IR vs green vs UV laser” at a specific moment: they are selecting a light source for a new process, qualifying a second supplier, or explaining to management why a system that looked equivalent on paper is underperforming on the line.
In each of those situations, the wavelength comparison is already settled. A process engineer designing flex circuit cutting already knows UV is the correct wavelength for polyimide substrates. A researcher scribing solar cells already knows green or UV outperforms IR on thin silicon films. The question that actually blocks the decision is one level deeper: within the correct wavelength, which source architecture will hold its performance characteristics across a 3,000-hour production run?
This is where amplifier architecture enters. And this is the comparison that virtually no published laser selection guide addresses—not the pharmaceutical marking articles, not the hobbyist engraving guides, not the general UV-versus-IR overviews that dominate the first page of search results. Those articles serve a real purpose for early-stage selection. They do not serve a process engineer who has already narrowed to UV and now needs to distinguish between a 10W fiber-amplified source at M² 1.6 and a 20W slab-amplified source at M² 1.3.
This article addresses that second-stage decision.
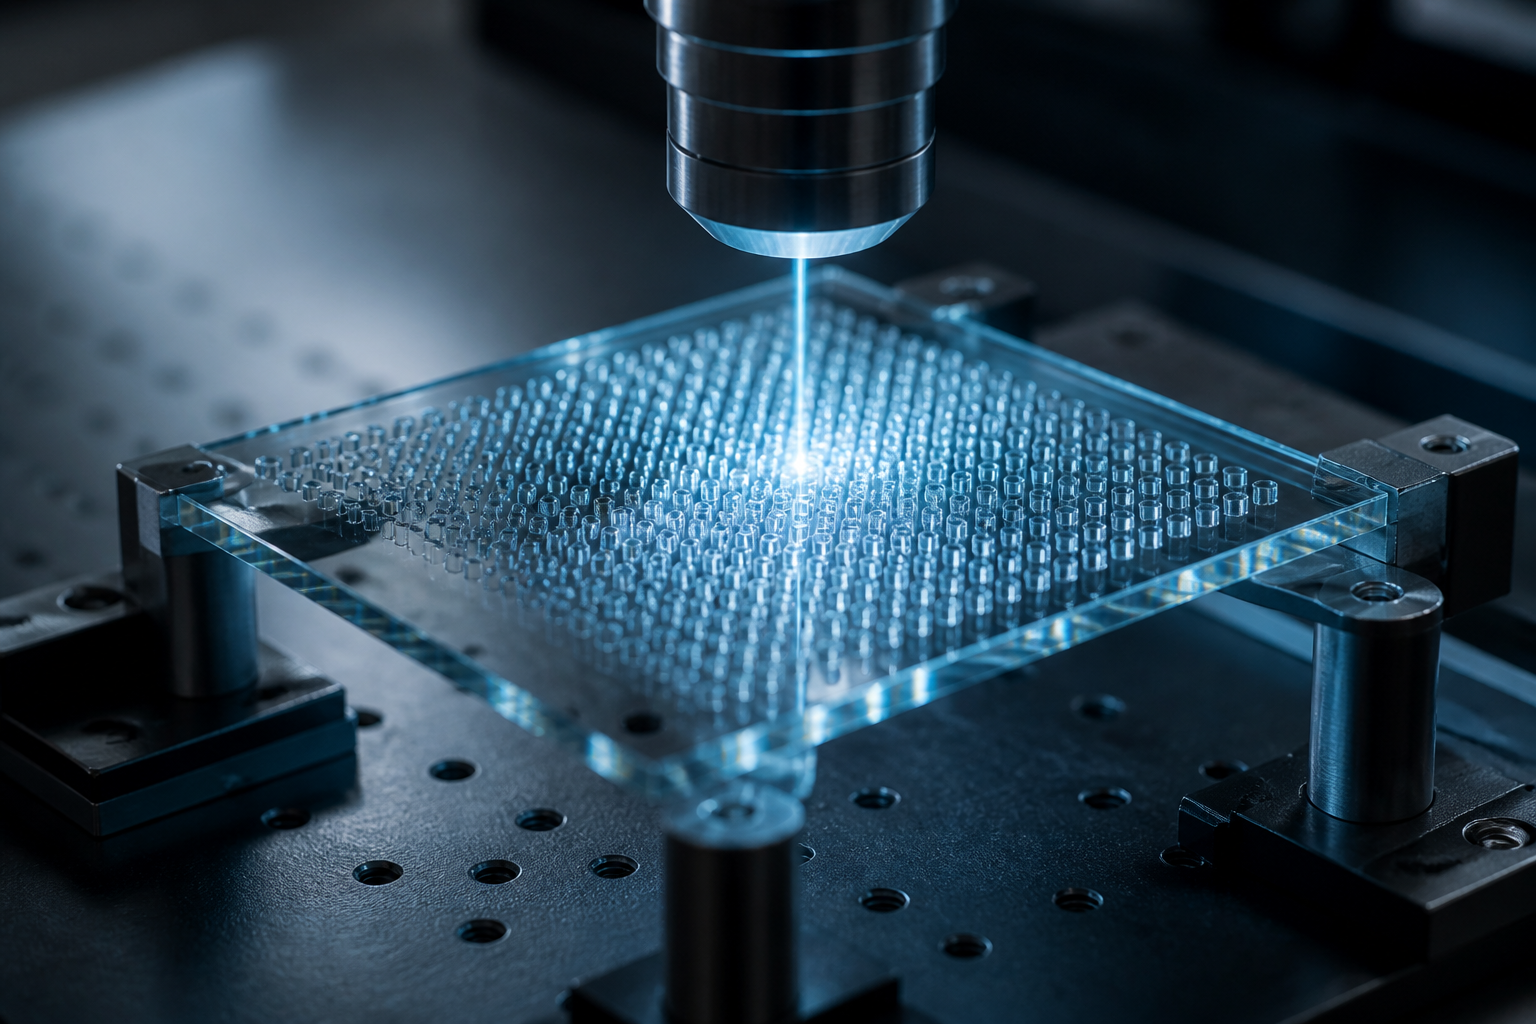
UV lasers achieve their precision advantage through photochemical ablation rather than thermal processing. At 355 nm, photon energy is high enough that material bonds break directly through nonlinear absorption, rather than through heat accumulation. This is the mechanism behind “cold processing”—the reason UV is the standard choice for heat-sensitive substrates including polyimide flex circuits, medical polymer films, and glass microstructures.
The cold ablation mechanism has a threshold condition: peak power density at the focal spot must exceed the nonlinear absorption threshold for the target material. For polyimide, this is typically in the range of 10⁹–10¹⁰ W/cm². This is where M² enters the equation directly. Focus spot diameter scales linearly with M², and power density scales with the square of spot diameter. A source with M² of 1.6 produces a spot 23% larger than one with M² of 1.3 at the same focal length and aperture—and delivers 40% lower peak power density at the surface.
If that peak power density drops below the nonlinear absorption threshold, ablation transitions from photochemical to thermal. The UV wavelength is still present. The cold ablation advantage is not. This is the mechanism behind the 2.6x precision gap described in the opening case—and it manifests specifically during sustained operation when fiber amplifiers experience thermal lensing.
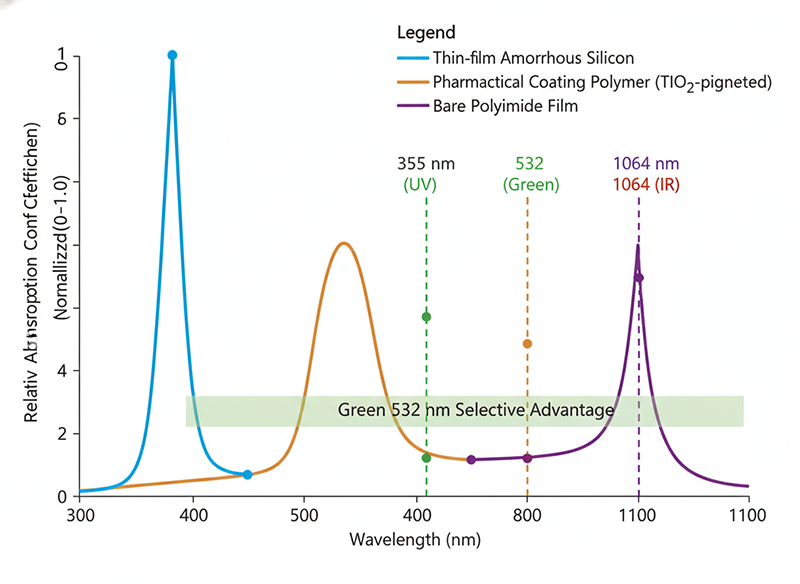
Green lasers occupy a specific and genuinely useful niche. At 532 nm, photon energy is lower than UV but higher than IR, and absorption profiles for several materials—including certain transparent polymers, thin silicon films, and biological tissues—make green the technically correct wavelength where UV would over-ablate and IR would under-absorb.
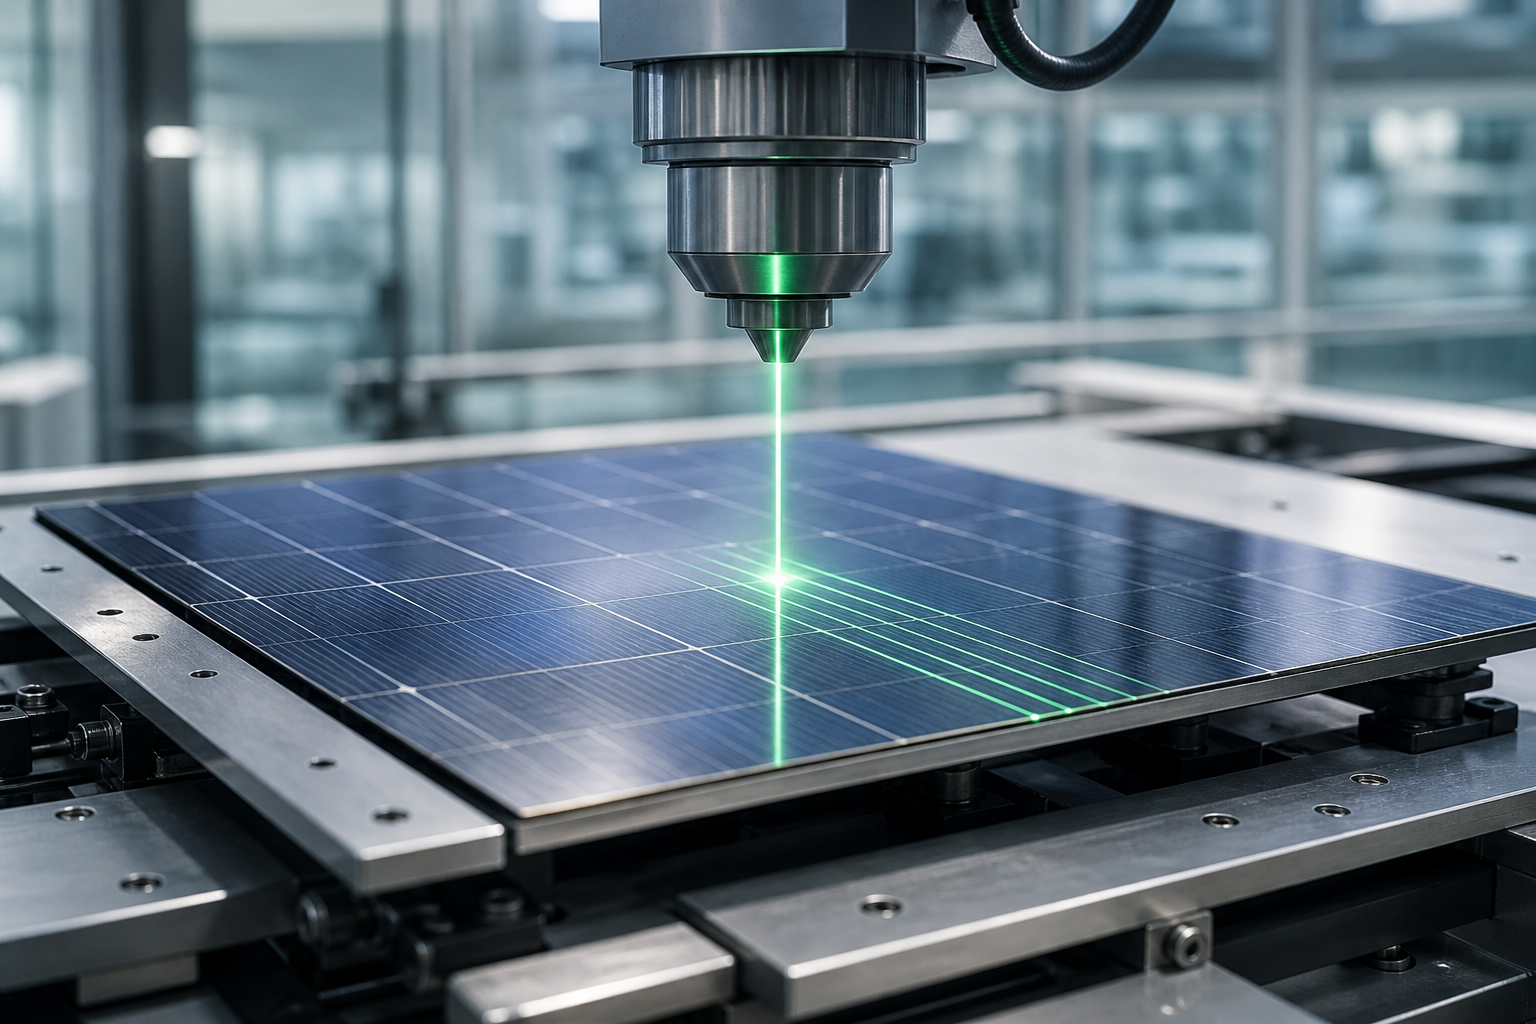
Solar cell scribing is the clearest example. Thin-film silicon absorbs green wavelengths more selectively than UV, allowing scribing of active layers without damaging adjacent structures. In pharmaceutical marking, certain coating chemistries respond to 532 nm with higher contrast than they do to 355 nm.
What green laser guides typically omit: the same M² stability argument applies. A green laser system using fiber amplification at 532 nm will experience thermal lensing at high average power. The effect is wavelength-independent—it is an amplifier architecture phenomenon. For high-power green applications requiring sustained precision, slab architecture provides the same M² stability advantage as it does at UV.
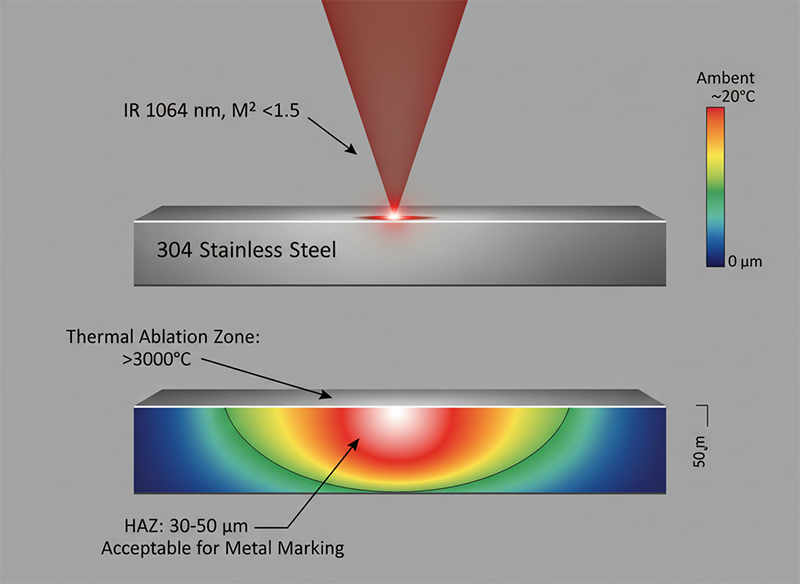
IR fiber lasers at 1064 nm are the correct choice for metal marking, deep engraving, and applications where thermal energy deposition is the intended mechanism. The thermal processing regime that makes IR lasers unsuitable for heat-sensitive polymers makes them efficient for cutting steel, annealing titanium, and high-speed marking of aluminum housings.
In IR applications, the relevant beam quality question is different. Because thermal processing is the goal, moderate M² variation affects the HAZ width rather than the cold-ablation threshold. For most IR marking and cutting applications, M² below 1.5 is sufficient. The constraint that matters more in IR is pulse energy consistency and peak power stability across the repetition rate range—parameters where well-designed fiber architectures perform reliably.
The practical implication: IR selection decisions appropriately focus on wavelength, power, and repetition rate. UV and green selection decisions must also address amplifier architecture and M² behavior at production power levels.
The three dominant architectures for industrial ultrafast laser sources—fiber, rod, and slab—differ primarily in how they manage thermal load in the gain medium.
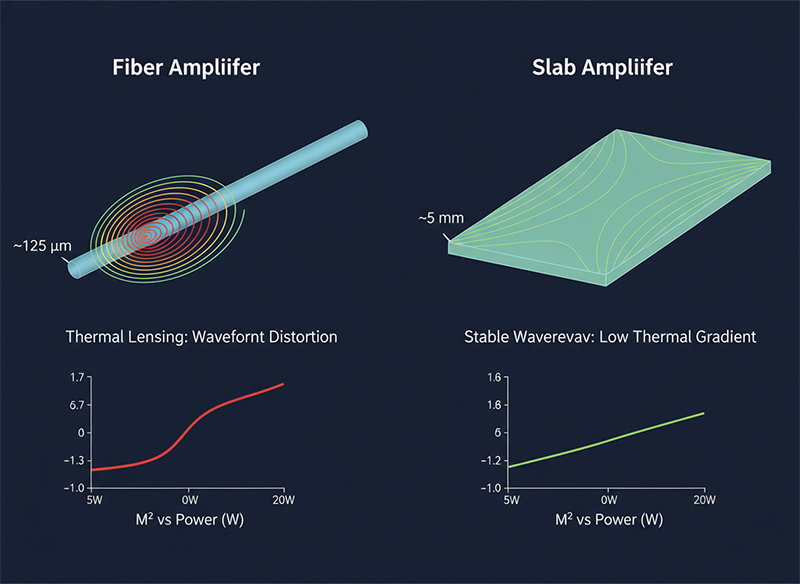
Fiber amplifiers confine the gain medium in a long, thin fiber geometry. This geometry provides efficient heat extraction per unit length, but the small cross-sectional area creates high thermal gradients under sustained high-power operation. The result is thermal lensing: the refractive index of the fiber changes with temperature, effectively introducing a weak lens into the beam path. M² increases. Spot size grows. At 10W average power, a well-designed fiber UV source might hold M² of 1.3. At 20W sustained, the same source may drift to M² of 1.7 or higher—a 70% degradation in beam quality with no change in the spec sheet wavelength.
Slab amplifiers use a planar gain medium with a large surface area relative to beam cross-section. Heat extraction is distributed across a wider area, thermal gradients are lower, and the thermal lensing effect is substantially reduced. A slab-amplified UV source operating at 20W sustained can maintain M² below 1.4 across a full 8-hour production shift—the same performance level it achieves at 5W. This stability is measurable, reproducible, and directly relevant to any application where edge quality or HAZ consistency must be maintained across a production run rather than just during a 10-minute qualification test.
| Parameter | Fiber Amplifier (UV, 20W) | Slab Amplifier (UV, 20W) |
|---|---|---|
| M² at 5W | 1.2–1.3 | 1.2–1.3 |
| M² at 20W sustained | 1.6–1.8 | 1.3–1.4 |
| Focus spot growth at 20W | +35 to +50% | <10% |
| HAZ consistency 8hr shift | Degrades | Stable |
| Recalibration frequency | Every 3–4 hours | Once per shift |
| Annual line downtime (recalibration) | ~48 hours | ~6 hours |
The 48-hour annual downtime figure is not theoretical. It represents a 12-minute recalibration every four hours across 240 production days—a direct consequence of M² drift forcing scan speed reduction to maintain ablation threshold.
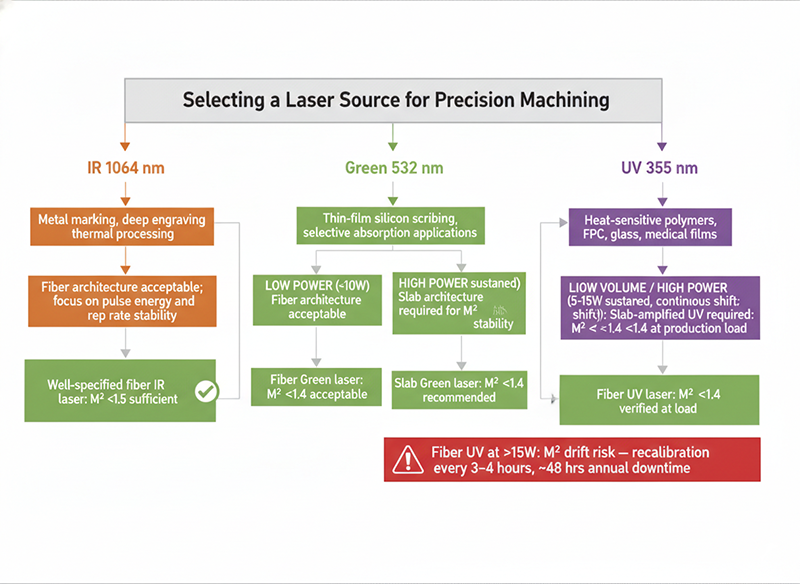
If your application is metal marking, deep engraving, or thermal material processing: IR at 1064 nm with a well-specified fiber laser is the technically correct and cost-efficient choice. Amplifier architecture is a secondary concern at IR wavelengths for most industrial applications.
If your application involves heat-sensitive materials—polyimide flex circuits, polymer films, medical device substrates, thin glass—and your production volume is under 500K parts per year: UV at 355 nm with a 5–10W source is sufficient. Verify M² stability at your production power level, not just at nominal spec conditions.
If your application requires UV or green precision at sustained high power (above 15W average), or if your production run exceeds 8 hours continuously: amplifier architecture is not a secondary variable. It is the primary differentiator. A slab-amplified source that holds M² below 1.4 at 20W will outperform a fiber-amplified source at the same wavelength and power—consistently, measurably, and in ways that compound across production volume.
If you are integrating a laser source into an OEM platform or multi-station production line: qualify M² at full production power, not at reduced test conditions. A source that holds M² of 1.3 during a 10-minute qualification test and drifts to 1.7 during a 6-hour production run has failed the qualification—the test just did not reveal it.
Wavelength comparison is the right place to start laser selection. It is not the right place to finish it.
Before committing to a source, request M² measurements at your intended production power—not at nominal or reduced conditions. Ask for M² versus average power curves across the full operating range. For UV and green applications above 10W, ask specifically whether the amplifier architecture has documented thermal lensing behavior at sustained load.
The difference between a source that performs during qualification and one that performs across 3,000 production hours is usually not wavelength. It is architecture.
If you are sourcing at scale, talking to a supplier directly surfaces details no product listing will tell you. Talk to our sourcing team →
The process engineer in the opening case did not make a bad decision. They made the decision that every comparison matrix in the industry trained them to make: identify the correct wavelength, verify power and pulse width, compare prices. The 2.6x precision gap only appeared at production power levels, over a sustained shift, in conditions the qualification test did not replicate.
That gap is not a flaw in how that engineer evaluated lasers. It is a flaw in how the industry has framed the comparison.
Wavelength determines whether your photons interact with your material. Amplifier architecture determines whether those photons arrive at a consistent spot size, at production power, eight hours into a shift. Both matter. Only one of them appears in most laser comparison guides—and it is not the one that causes production failures.
Q: What is the main difference between IR, green, and UV lasers for precision machining?
Wavelength determines the material absorption mechanism: UV (355 nm) uses photochemical cold ablation for heat-sensitive materials, IR (1064 nm) uses thermal processing for metals and dense materials, and green (532 nm) occupies specific niches where selective absorption outperforms both. However, within each wavelength, amplifier architecture and M² stability determine whether the theoretical precision advantage of shorter wavelengths is achieved in practice.
Q: Why does M² matter for laser precision cutting?
M² (beam quality factor) directly determines the minimum achievable focus spot size. A beam with M² of 1.6 produces a spot 23% larger than one with M² of 1.3 at the same focal length and aperture. Because peak power density scales with the square of spot diameter, M² degradation of that magnitude reduces surface power density by 40%—potentially dropping below the ablation threshold for cold processing and shifting the mechanism from photochemical to thermal.
Q: What is thermal lensing in fiber laser amplifiers?
Thermal lensing occurs when sustained high-power operation creates temperature gradients in the gain medium, causing the refractive index to vary across the beam cross-section. In fiber amplifiers, the small cross-sectional area concentrates this effect, causing M² to increase progressively with average power. A fiber UV source specified at M² 1.3 may operate at M² 1.7 or higher at sustained 20W output—a beam quality degradation invisible in standard spec sheets.
Q: When should I choose a slab amplifier over a fiber amplifier for UV laser applications?
Choose slab amplification when your UV application requires sustained power above 15W average, operates in continuous production shifts of 6 hours or more, or demands edge consistency within ±2 µm across the full production run. Slab architecture distributes thermal load across a larger gain medium surface, maintaining M² below 1.4 at production power levels where fiber amplifiers typically drift to M² 1.6 or higher.
Q: Can two UV lasers with identical wavelengths produce different precision outcomes?
Yes, and the difference can be substantial. In documented qualification scenarios comparing fiber-amplified and slab-amplified UV sources at the same 355 nm wavelength and 15W average power, edge deviation on 50 µm FPC traces differed by a factor of 2.6—from ±1.5 µm to ±4 µm. The cause was M² drift in the fiber source under sustained thermal load, not any difference in wavelength or nominal pulse parameters.
Q: How do I test M² stability at production conditions rather than nominal spec conditions?
Request M² measurements at multiple power levels across the full operating range—typically 30%, 60%, and 100% of rated average power. Ask for measurements taken after 30 minutes of continuous operation at each power level, not from a cold start. For applications involving 8-hour production shifts, ask specifically for M² data at sustained operation rather than peak or intermittent conditions. Reputable suppliers provide M²-versus-power curves; treat the absence of this data as a qualification risk.
Q: Is green laser (532 nm) affected by the same amplifier architecture considerations as UV?
Yes. Thermal lensing is an amplifier architecture phenomenon independent of output wavelength. A fiber-amplified green laser at 532 nm will experience M² drift at high average power by the same mechanism as a fiber-amplified UV source. For high-power green applications requiring sustained precision—solar cell scribing lines, thin-film processing—slab architecture provides the same M² stability advantage as it does at UV wavelengths.
Q: What annual production line cost does M² drift introduce?
In a scenario where M² drift requires recalibration every four hours at production power, across a 240-day production year with two recalibrations per shift at 12 minutes each: annual downtime attributable to M² instability is approximately 48 hours of production line time. At a line rate of $200–500 per hour depending on automation level, this represents $9,600–$24,000 in annual opportunity cost from a single laser station—a figure that is rarely visible in the initial equipment acquisition comparison.
[1] International Organization for Standardization. ISO 11146-1:2021 — Lasers and laser-related equipment: Test methods for laser beam widths, divergence angles and beam propagation ratios — Part 1: Stigmatic and simple astigmatic beams. https://www.iso.org/standard/72002.html
[2] Siegman, A.E. “Defining, measuring, and optimizing laser beam quality.” Proceedings of SPIE, vol. 1868, Laser Resonators and Coherent Optics: Modeling, Technology, and Applications, 1993. https://doi.org/10.1117/12.150601
[3] Dawson, J.W., et al. “Analysis of the scalability of diffraction-limited fiber lasers and amplifiers to high average power.” Optics Express, vol. 16, no. 17, pp. 13240–13266, 2008. 光纤放大器在高平均功率下的热透镜效应分析;文中”光纤架构在持续高功率下M²漂移至1.6–1.8″的物理机制依据。 https://doi.org/10.1364/OE.16.013240
[4] Negel, J.-P., et al. “Ultrafast thin-disk multipass laser amplifier delivering 1.4 kW (4.7 mJ, 1030 nm) average power converted to 820 W at 515 nm and 234 W at 343 nm.” Optics Express, vol. 23, no. 16, pp. 21064–21077, 2015. https://doi.org/10.1364/OE.23.021064
[5] Breitling, D., et al. “Fundamental aspects in machining of metals with short and ultrashort laser pulses.” Proceedings of SPIE, vol. 5339, Commercial and Biomedical Applications of Ultrashort Pulse Lasers, 2004.https://doi.org/10.1117/12.527827