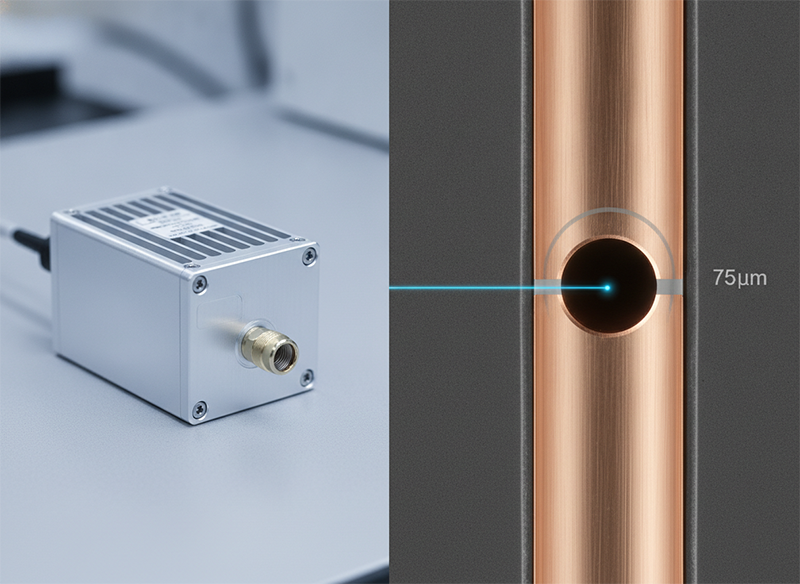
The spec sheet cleared qualification. The production line failed.
A process engineer qualifying an HDI microvia drilling line had run 2,000 holes at cold start: HAZ under 4 µm, no recast layer on the via walls, yield at 99.3%. The light source showed 0.5 mJ per pulse — enough margin above the cold ablation threshold for 75-µm copper-clad vias. Production approval came through.
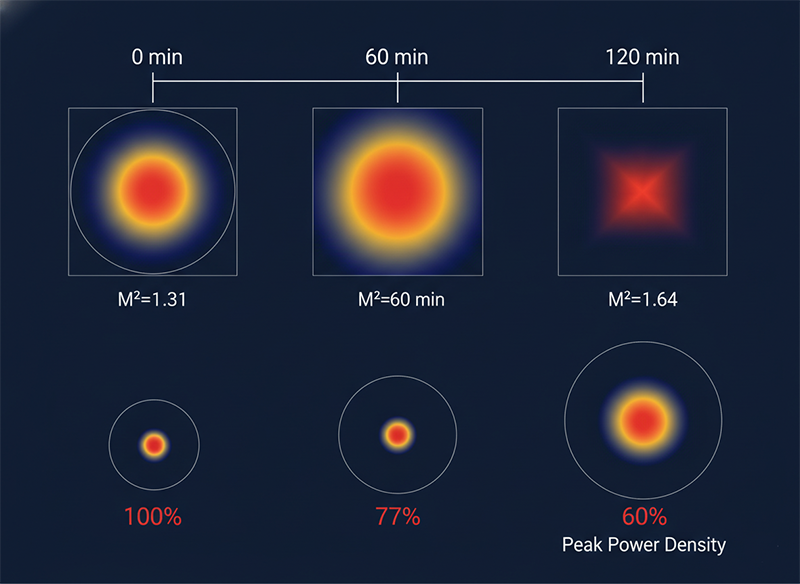
Six weeks later, the line began flagging recast-layer failures on panels drilled late in each shift. The pulse energy on the spec sheet had not changed. The laser had not been serviced. What had changed was M²: from 1.31 at cold start to 1.64 after 110 minutes of continuous operation. That drift reduced peak power density at the workpiece focus by roughly 1.6× — enough to push the last 20,000 holes of an 80,000-hole panel below the cold ablation threshold.
“The spec sheet pulse energy was a cold-start number. The process engineer had specified the laser on a metric that only held for the first two hours of every shift.” — process engineer, HDI microvia drilling line qualification
The problem was not the laser. The problem was the specification framework.
Average power tells you how much electricity you need and how much heat your cooling system must handle. Pulse energy — combined with M² stability across a full production run — determines whether cold ablation actually fires at the workpiece. When specifying an ultrafast laser light source, average power belongs in the facilities checklist. Pulse energy, and the amplifier architecture that keeps it stable, belongs in the process engineering specification.
Process engineers evaluating ultrafast laser light sources routinely encounter spec sheets with two power figures: average power in watts, and pulse energy in mJ or µJ. In most purchasing conversations, average power becomes the primary comparison metric. It is readable, comparable across vendors, and carries an intuitive connection to throughput.
But average power is a derived number — pulse energy multiplied by repetition rate. The same 30W average power can come from 0.3 mJ at 100 kHz or from 0.15 mJ at 200 kHz. In the first configuration, pulse energy may clear the cold ablation threshold for copper with margin. In the second, it may not. No amount of average power compensates for a pulse that falls below the nonlinear absorption threshold of the target material.
This distinction matters most in production environments where panels, wafers, or glass substrates run for 1.5 to 4 hours per job. Amplifier gain media heat under sustained load, thermal gradients develop, and M² drifts — reducing the peak power density delivered to the workpiece even while the average power readout on the controller holds steady.
We have seen this failure mode across via drilling, glass scribing, and FPC cutting lines. The specification conversation almost always started with average power. The production failure always traced back to pulse energy and M² stability.
When your facilities team receives a light source specification, they want average power. It determines electrical supply, chiller thermal load, and safety zone classification. These are legitimate engineering requirements.
When your process team receives the same specification, average power tells them almost nothing about whether the laser will perform the intended process.
Cold ablation is driven by peak power density at the workpiece focus, measured in W/cm². The relevant relationship connects pulse energy (E), pulse duration (τ), and focused spot area (A):
Peak power density = E / (τ × A)
Average power appears in none of these terms. The focused spot area is determined by M² and the focusing optics — not by average power. A light source delivering 20W average power with M² = 1.2, focused through a standard f-theta lens, produces higher peak power density at focus than a 30W source with M² = 1.7 through the same optics.
Comparing average power across vendors, without M² and pulse energy, is comparing two quantities that do not determine the process outcome.
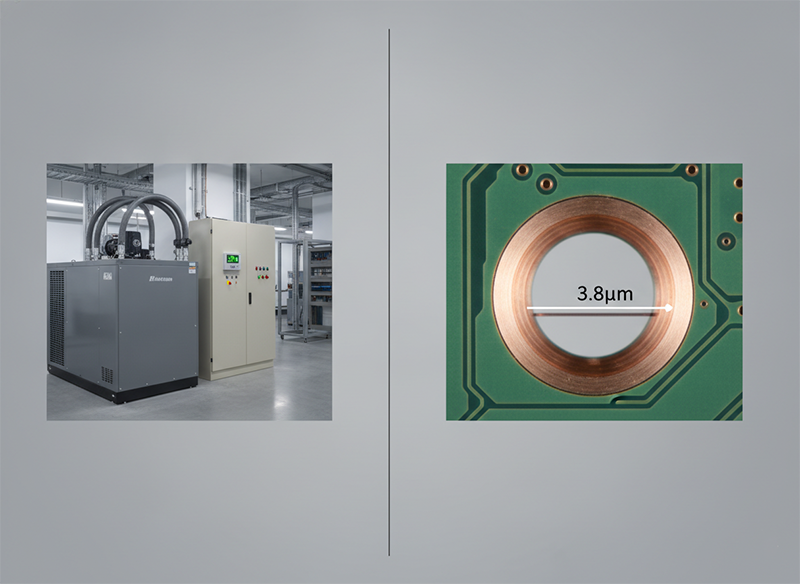
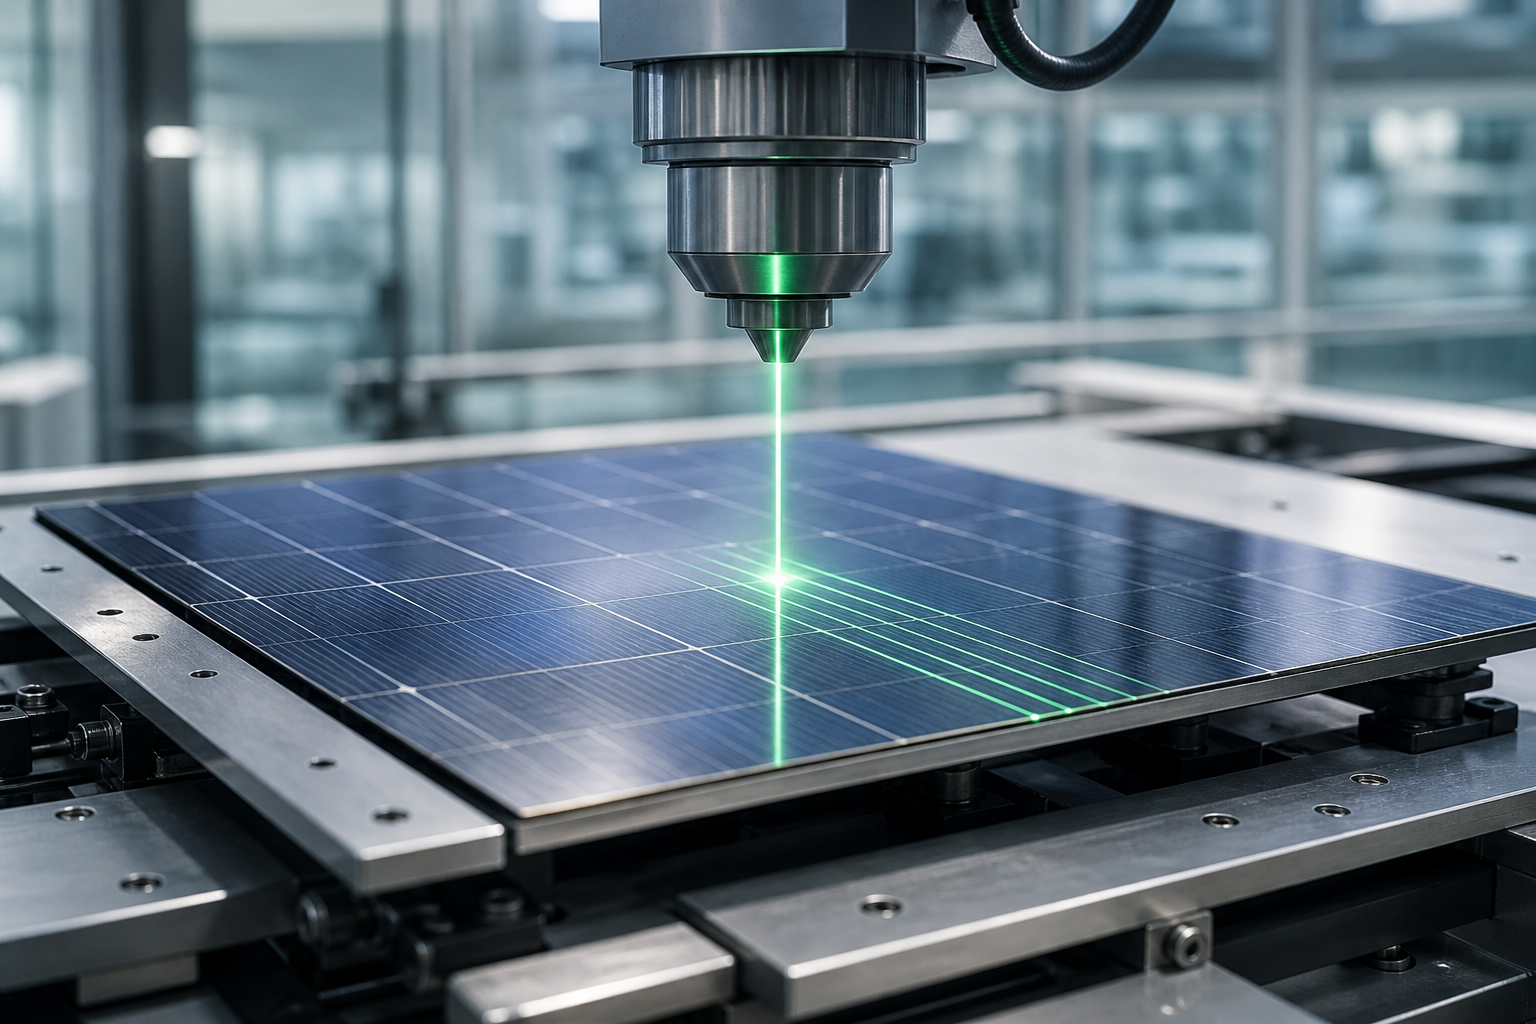
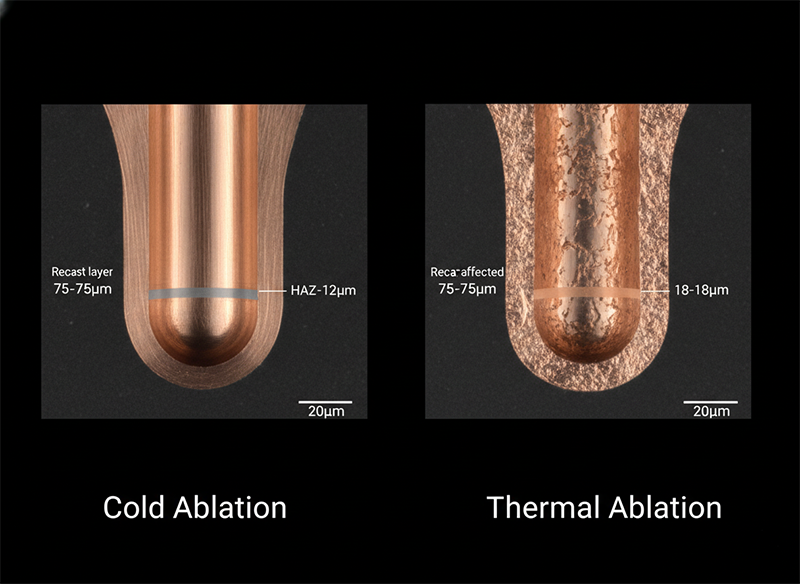
For precision micromachining of metals, glass, ceramics, and polymer composites, cold ablation requires peak power density above a material-specific nonlinear absorption threshold. For copper, this is approximately 10¹⁰ W/cm². Below this threshold, energy absorption shifts to a thermal mechanism, heat diffuses into surrounding material, and the result is a measurable HAZ — with possible recast layer formation on via walls that standard desmear chemistry cannot remove.
The thermal diffusion length during a single pulse is L = √(D × τ), where D is thermal diffusivity and τ is pulse duration. For copper (D ≈ 1.17 × 10⁻⁴ m²/s), a 200 ps pulse gives L ≈ 0.15 µm per pulse — a negligible thermal footprint. This calculation holds only when the pulse delivers sufficient peak power density to operate in the nonlinear absorption regime. If M² has drifted and the focused spot has expanded, peak power density drops, and the thermal diffusion calculation no longer applies.
The practical result: HAZ widens not because pulse duration changed, but because effective pulse energy at focus fell below the cold ablation threshold. The spec sheet continues to report correct average power and correct output pulse energy at the aperture. The workpiece is seeing a different laser.
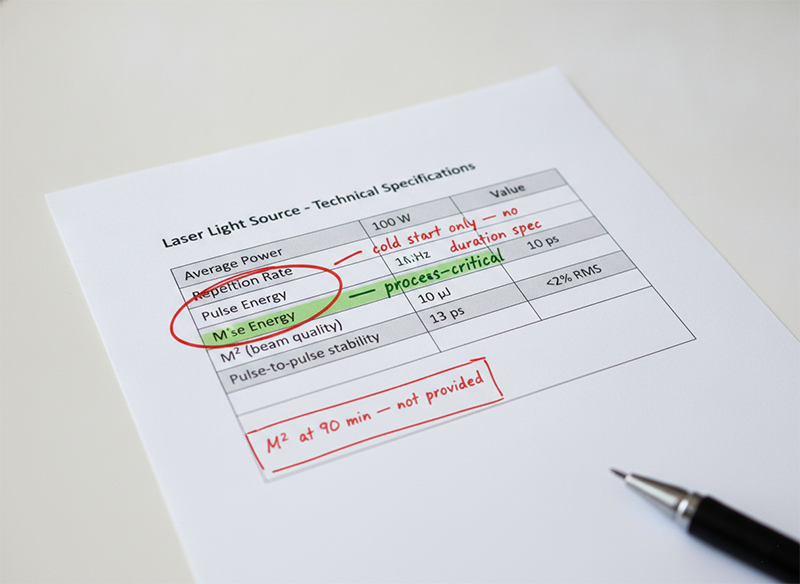
This is the argument for specifying pulse energy alongside a verified, sustained M² value — not the cold-start M² in the datasheet footnote, but M² across the full operating duration of your longest production job.
Most ultrafast laser light source datasheets report M² as a single number, measured at cold start, with no duration qualification. This is technically compliant with ISO 11146 measurement conditions — but ISO 11146 specifies how to measure M², not how long the laser must have been running before measurement.
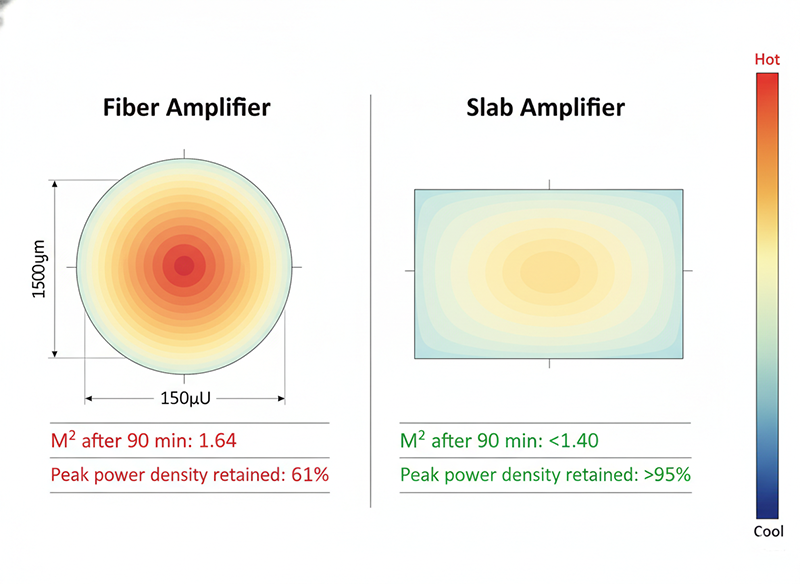
For a two-hour production run, the cold-start M² is not the operating M². In fiber-based amplifier architectures, sustained high average power drives thermal loading into the gain fiber. The resulting temperature gradient produces a lensing effect that distorts wavefront quality and causes M² to drift — typically from values near 1.2–1.3 at cold start toward 1.5–1.7 after 60 to 90 minutes at rated power.
The relationship between M² drift and peak power density loss is compounded. Focused spot area scales with M²², so an M² increase from 1.3 to 1.6 expands the focal spot area by (1.6/1.3)² ≈ 1.51×, and peak power density drops by the same factor. For a process operating with 40% margin above cold ablation threshold at cold start, this drift can eliminate that margin entirely by hour two.
Slab amplifier architectures distribute thermal load across a larger gain medium cross-section, suppressing the temperature gradient that drives thermal lensing. Our slab-integrated amplifier holds M² < 1.4 across sustained four-hour operating runs — meaning pulse energy delivered to the workpiece at hour four is functionally equivalent to pulse energy at cold start.
| Parameter | Fiber Amplifier (industry typical) | Slab Amplifier (Laserion) |
|---|---|---|
| Cold-start M² | 1.2–1.3 | < 1.4 |
| M² after 90 min at rated power | 1.5–1.7 | < 1.4 |
| Peak power density drift (2 hr run) | −30% to −50% | < 5% |
| HAZ consistency across 80K-hole panel | Degrades in final 30–40% of panel | Consistent panel-to-panel |
| Spec sheet M² qualification basis | Cold start only (ISO 11146) | Sustained 4-hour soak at rated power |
If your qualification protocol runs 2,000 holes at cold start and approves on that basis, you have not qualified the light source for a production panel that takes 3 hours to drill. You have qualified the first 30 minutes of every shift.
When evaluating a picosecond laser light source, the following parameters are process-relevant and should be requested explicitly if not listed:
Pulse energy at your operating repetition rate. Not peak pulse energy across all configurations, but pulse energy at the specific repetition rate your process requires. Average power divided by repetition rate gives nominal pulse energy — verify this matches the stated value.
M² after thermal stabilization at rated power. Request M² measured after a minimum 60-minute warm-up at full rated average power. Cold-start M² underrepresents the operating condition for any production job longer than 30 minutes.
M² stability across extended operation. Ask for drift data across a 4-hour continuous run at rated power. If the vendor cannot provide this, the cold-start M² is the only condition they can defend.
Pulse-to-pulse energy stability (RMS). For via drilling and glass scribing, pulse-to-pulse variation above ±2% RMS introduces hole-to-hole diameter variation that accumulates across large panels. This specification is rarely on standard datasheets — request it directly.
If a vendor’s datasheet provides only average power, beam diameter (1/e²), and a single cold-start M², you are working with incomplete process-relevant data. Requesting the above parameters — and treating the response as a qualification criterion — separates light sources that hold specification in production from those that only hold it in the lab.
If your process runs jobs shorter than 30 minutes at rated power, cold-start M² and nominal pulse energy are sufficient to characterize the light source for initial screening.
If your process runs jobs longer than 60 minutes — panel drilling, large-format glass scribing, extended FPC runs — M² stability across the full job duration is the critical variable. Ask vendors for sustained-run M² data. If unavailable, build a 60-minute thermal soak into your qualification protocol and remeasure M² at the end. A source that shows M² > 1.5 at 90 minutes is not rated for your application regardless of what average power it delivers.
If your process operates close to the cold ablation threshold — thin copper via drilling, HAZ-sensitive ceramic scribing — specify minimum pulse energy at focus with minimum sustained M², not average power. Calculate required pulse energy from peak power density requirements, work backward to repetition rate, then derive average power from that. Average power should be the output of the specification process, not the input.
Before finalizing a light source specification for a production line, confirm three things no standard datasheet will tell you: the M² value after 90 minutes at rated power, pulse-to-pulse energy stability under continuous operation, and whether the vendor holds application data from your specific process family — not generic demonstrations, but HAZ and recast layer measurements from your material type and geometry.
If you are integrating a light source into an OEM system and your customer will run multi-hour production jobs, resolve these questions before system design is locked — not during customer acceptance testing.
If you are sourcing at scale, talking to a light source supplier directly can surface sustained operating condition data that no product listing will tell you.
The engineer who saw recast-layer failures six weeks into production had not specified incorrectly by conventional standards. The datasheet had passed review. The cold-start M² had cleared qualification. What the specification framework had not required was M² under the actual operating condition — which was not cold start, but hour two of a continuous production shift.
Specification frameworks inherit the assumptions of the instruments used to build them. Power meters measure average power accurately. ISO 11146 M² measurements are taken at cold start. Neither instrument tells you what the workpiece sees at hour three of a panel run.
The right question when specifying an ultrafast laser light source is not “what average power does this deliver?” It is: “what pulse energy reaches my workpiece focus, under sustained operating conditions, at hour four?” A light source whose architecture answers that question the same way at cold start and at shift end is the one that holds process yield from the first panel to the last.
What is the difference between average power and pulse energy in a picosecond laser? Average power is the total energy delivered per second, averaged across all pulses and the gaps between them. Pulse energy is the energy in a single pulse. The same average power can result from very different pulse energies depending on repetition rate. For precision micromachining, pulse energy determines whether each pulse achieves cold ablation at the workpiece — average power does not.
Why does M² affect the effective pulse energy at the workpiece? M² determines minimum achievable focal spot size for a given lens. A larger M² produces a larger focal spot, which spreads the same pulse energy across a greater area and reduces peak power density. Peak power density — not pulse energy alone — determines whether cold ablation fires. M² drift during a production run therefore reduces effective process energy at focus even while the laser’s output pulse energy remains unchanged.
How much does M² typically drift during a production run in fiber-based amplifiers? In fiber amplifier architectures operating at rated average power, M² typically drifts from cold-start values of 1.2–1.3 toward 1.5–1.7 after 60 to 90 minutes of continuous operation. The mechanism is thermal lensing driven by sustained thermal loading in the gain fiber. This drift is not captured by standard ISO 11146 M² measurements, which are taken at cold start.
What is the cold ablation threshold, and how is it related to pulse energy? Cold ablation occurs when peak power density at the workpiece exceeds the nonlinear absorption threshold of the target material, removing material before heat diffuses to surrounding zones. For copper, this threshold is approximately 10¹⁰ W/cm². Pulse energy and M² together determine whether peak power density clears this threshold. Pulses above the threshold produce HAZ of 3–5 µm; pulses below it produce thermal ablation with HAZ of 10–25 µm and possible recast layer formation immune to desmear chemistry.
How should I qualify a laser light source for multi-hour production runs? Run the light source at rated power and repetition rate for at least 90 minutes before measuring M², pulse energy at the aperture, and HAZ in your target material. Compare these values to cold-start measurements. If M² has increased more than 0.15 above the cold-start value, or if HAZ has widened by more than 20%, the source is not thermally stable for your run duration. Extend the qualification soak to match your longest single production job.
What amplifier architecture best maintains M² stability under sustained load? Slab amplifier architectures distribute thermal load across a larger gain medium cross-section than fiber or rod geometries, reducing the temperature gradient responsible for thermal lensing. Laserion’s slab-integrated amplifier is designed to hold M² < 1.4 across a four-hour continuous run at rated average power, keeping pulse energy at the workpiece focus consistent from cold start through end of shift.
Can I calculate required pulse energy directly from my process requirements? Yes. Start from the cold ablation threshold of your target material in W/cm². Multiply by pulse duration in seconds and focused spot area in cm² — accounting for the M² value you can sustain across your full run — to get minimum required pulse energy at the workpiece. Add optical transmission losses between aperture and workpiece. Then apply margin for any residual M² variation. Divide into your average power budget to confirm the repetition rate is feasible. This is the correct specification sequence; most buyers run it in reverse.
Is average power irrelevant when specifying a laser light source? No. Average power determines electrical supply requirements, chiller thermal load, and laser safety zone classification — all essential for facilities and system integration. For process engineering, however, average power is an output of the specification, not an input. Determining process yield requires specifying pulse energy and sustained M² first, then deriving the average power that results.